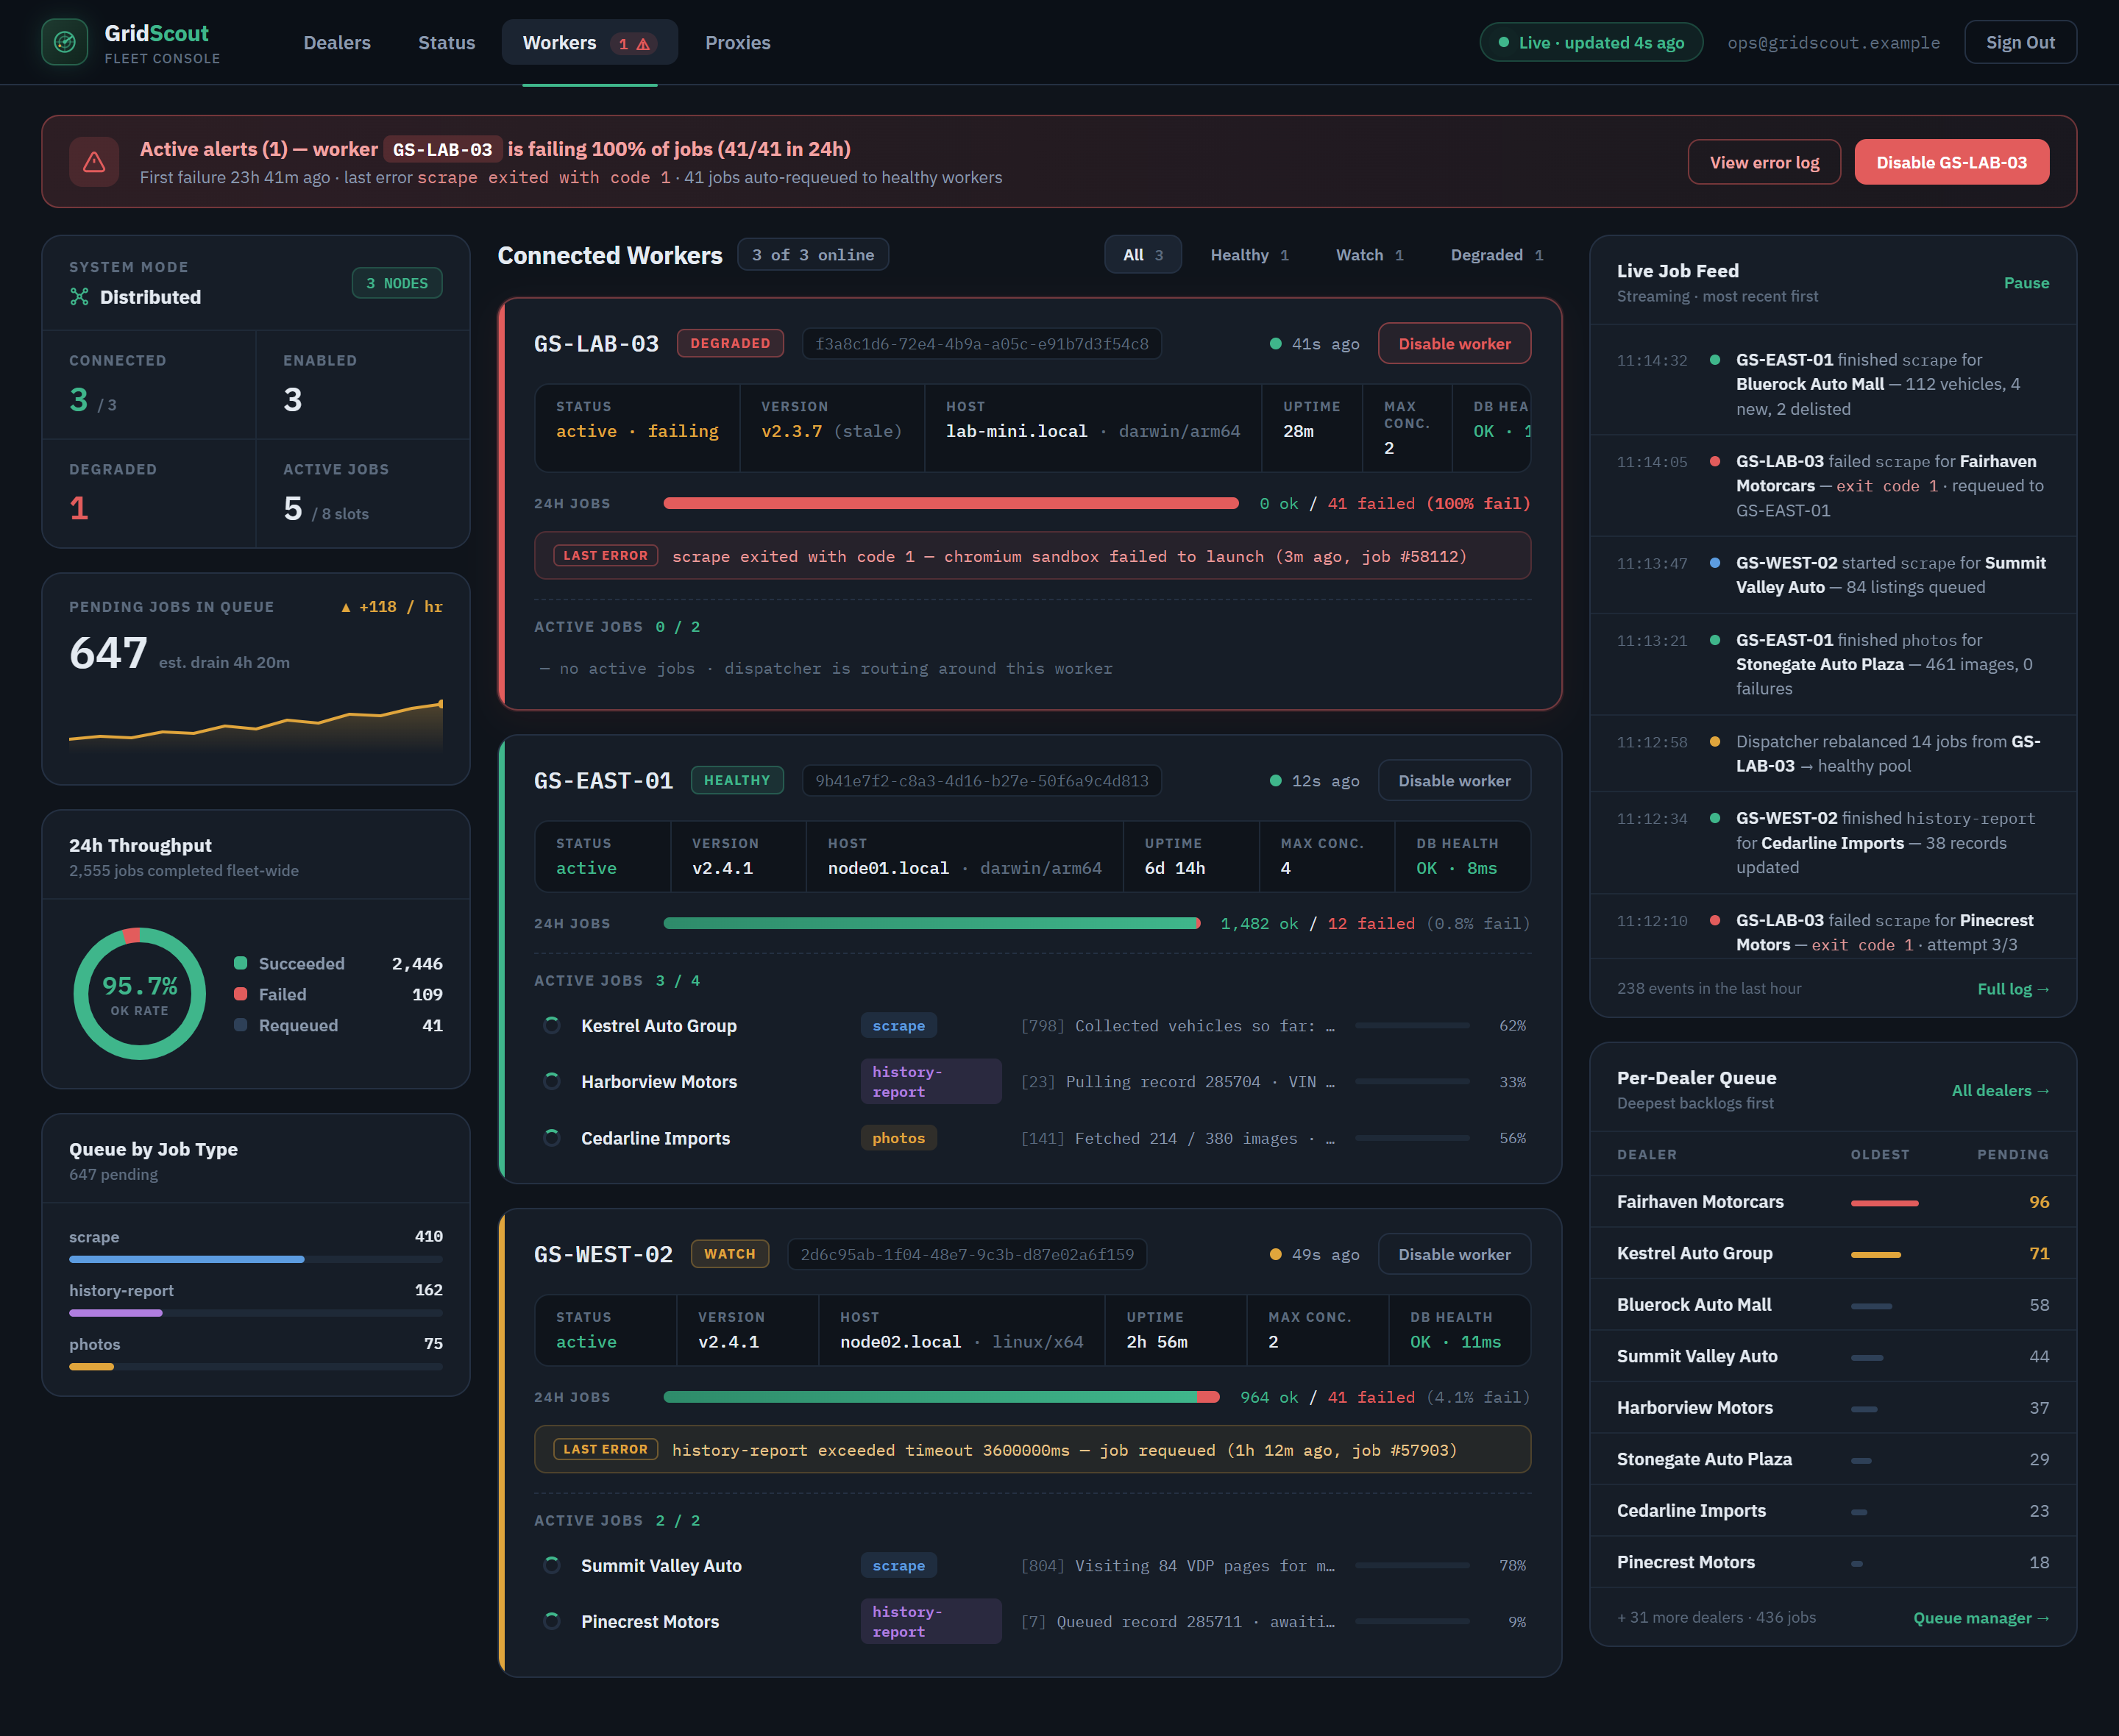
A control-room-style console for a distributed data-collection operation: one dense screen that shows whether the worker fleet is healthy right now, surfaces a failing machine within minutes, and reassigns its jobs to healthy ones.
Anonymized client build . GridScout
The challenge
The client runs an automotive data operation that continuously collects dealer-lot inventory, vehicle listings, history reports, and photos across dozens of dealership websites, using a distributed fleet of scraper workers running on machines in multiple locations.
A distributed fleet like this fails quietly. A worker on someone’s spare machine drops offline, a target site changes its layout, a job type starts erroring, and the data gap only shows up days later as stale inventory downstream. The operator needed to answer at a glance: is the fleet healthy right now, which workers are connected, degraded, or failing; is the queue draining or growing, and which job types are backing up; and when a worker breaks, what exactly is it failing on, and how to stop the bleeding without losing the jobs.
How we solved it
We built a control-room-style fleet console, one dark, dense screen for a wall monitor or a 2 a.m. incident check, where the worst problem is always the first thing you see.
Alerting that leads a failing worker is the first thing on screen. A banner names the worker, quantifies the failure (100% of jobs in 24h), shows the last error, and confirms its jobs were reassigned to healthy workers, with disable and error-log actions one click away
Fleet summary rail distributed-mode status, connected, enabled, and degraded worker counts, live queue depth with a trend line and estimated time to clear, 24h throughput (succeeded, failed, requeued), and queue composition by job type, scrape, history-report, photos
Worker panels each worker gets a health strip, version, host, and platform metadata, uptime, database health, a 24h ok-to-fail ratio bar, the last error verbatim, and its active jobs with per-job progress ("collected vehicles so far"), so a degraded machine can be diagnosed without remote-logging into it
Live job feed and per-dealer queue a streaming feed of job completions and a table of pending work by dealership, so coverage gaps are visible per data source, not just in aggregate
Fleet console
One dark, dense screen for the operator: the failing-worker banner up top, a fleet summary, per-worker health panels with the last error verbatim, and a live job feed with the per-dealer queue, built for a wall monitor or a 2 a.m. incident check.
Why it matters
Failures that used to surface as missing data days later now surface as a banner within minutes, with the diagnosis attached. Jobs reroute around failing workers, so a sick machine costs throughput instead of coverage, and one console replaces hunting through logs on every machine in the fleet.
Outcome metrics available on request, once the client’s numbers are cleared for publication.